
Order Flow vs Indicators: Which Is Better in 2026?
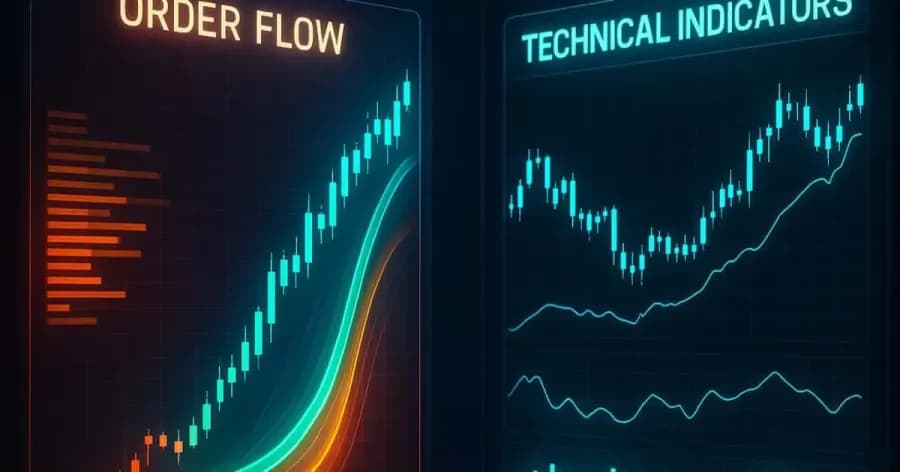
Order Flow vs Indicators: The debate continues to be one of the most talked-about topics among traders in 2026. Both approaches aim to optimize decision-making in markets but offer distinct advantages depending on strategy and goals.
To master trading tools effectively, it's essential to understand their core differences, strengths, and how they can work together.
What Are Technical Indicators?
Technical indicators involve mathematical calculations applied to historical price and volume data. They help traders identify trends, momentum, and potential reversals.
Commonly Used Indicators
Popular technical indicators include:
- Moving Averages (MA) - Smooth price trends for better clarity.
- Relative Strength Index (RSI) - Measures speed and change of price movements.
- MACD - Highlights momentum shifts and trend direction.
Indicators are widely used due to their simplicity and ability to automate decision-making in trading systems.
Limitations of Indicators
Despite their utility, most indicators are lagging tools. They reflect past market activity, which may delay signals in fast-moving markets. However, because they offer straightforward rules for analysis, they remain accessible and popular among traders.
What Is Order Flow?
Order flow is a real-time data analysis technique focusing on active buy and sell orders in the market. Tools that facilitate order flow analysis include:
- Footprint Charts - Show volumes at specific price levels.
- Depth of Market (DOM) - Displays live order book data.
- Delta Volume Charts - Gauge market sentiment by comparing buy and sell orders.
Why Order Flow Matters
Unlike indicators, order flow provides immediate insight into market sentiment and liquidity. This allows traders to react more quickly to shifts in demand, often before these are reflected in price action or indicators.

Challenges of Order Flow
Using order flow effectively requires experience. Real-time data can introduce noise and false signals, especially for less seasoned traders. Furthermore, it may require specialized tools and high-speed feeds.
Speed vs Simplicity
With advancements in trading technology, order flow data has become increasingly accessible to retail traders. Its ability to reveal price mechanics in real time makes it ideal for short-term, high-frequency strategies. However, complexity remains a barrier for beginners.
Conversely, indicators remain a reliable choice for medium to long-term strategies. Their simplicity allows traders to filter out market noise and focus on broader trends.
Order Flow and Indicators: Complementary Tools
Professionals often blend order flow and indicators rather than choosing one over the other. This hybrid strategy takes advantage of:
- Indicators for historical context and simplified trend identification.
- Order flow to confirm whether indicator signals align with current market sentiment.
For example, a breakout confirmed by moving averages becomes more credible if order flow shows strong buying activity. Similarly, historical indicator-based data can validate live order flow signals by putting them into a broader context.
Which Tool Wins in 2026?
There is no single winner in the order flow vs indicators debate. Each serves specific purposes and excels under different conditions:
- Order flow: Best for real-time analysis and strategies requiring instant decision-making.
- Indicators: Ideal for longer timeframes and situations where simplicity matters.
The most successful traders of 2026 adopt a hybrid methodology, leveraging the strengths of both tools. Combining real-time insights with historical trends helps overcome limitations and navigate all market conditions effectively.
Is On-Chain Data Replacing Technical Analysis in Crypto? Top Crypto Trading Tools Professional Traders Use in 2026 How AI Trading Tools Are Revolutionizing Crypto Markets How AI Agents Are Changing DeFi and Technical AnalysisRelated: Trading Tools | Detect Fake Volume
Frequently Asked Questions
Q: What are order flow indicators?
A: Order flow indicators analyze buy and sell orders to visualize market sentiment and potential price direction. They often display data like bid/ask volume, trade size, and order book depth.
Q: How do order flow indicators differ from traditional technical indicators?
A: Order flow indicators focus on the actual transactions and order book dynamics, providing insight into supply and demand imbalances. Traditional technical indicators typically derive signals from price and volume data over time.
Q: What are some common types of order flow indicators?
A: Common types include volume profile, market profile, cumulative delta, and footprint charts. Each offers a different visualization of order execution and market structure.
Q: Can order flow indicators predict future price movements?
A: Order flow indicators provide real time insights into market activity, which can suggest potential short term price movements. They do not guarantee future price action and should be used in conjunction with other analysis.
Q: What are the benefits of using order flow indicators?
A: Benefits include identifying institutional activity, spotting potential reversals, and understanding the strength of price moves. They can offer a more granular view of market mechanics than traditional indicators.